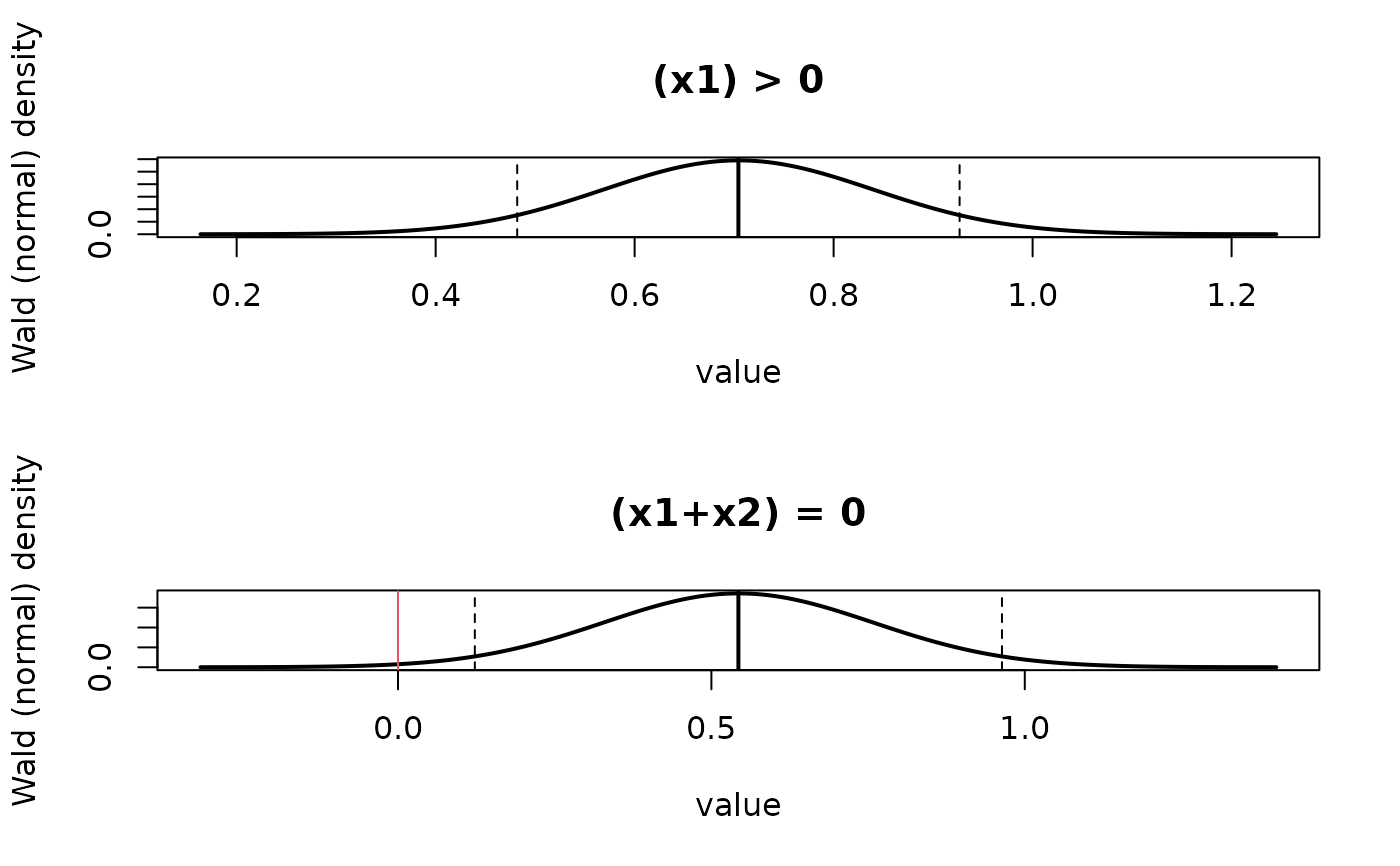
Draws one panel per hypothesis of a hypothesis() result, stacked
in one column, nvariables panels to a page, as brms's
plot.brmshypothesis() lays them out. Each panel shows what the
method has: the distribution of the draws (a histogram with a
density line) for method = "boot" and for posterior draws, the
profile of the log-likelihood for method = "profile", and the
normal density of the Wald estimate otherwise. Vertical lines mark
the estimate, the interval and zero.
Arguments
- x
A
frmtmb_hypothesisobject, or onefrmtmb_hyp_plotfor the print and plot methods of a plot object.- nvariables
The number of hypotheses per page.
- N
brms's older name for
nvariables. When set, it replacesnvariableswith brms's deprecation warning.- ignore_prior
If
TRUE, leave out the density of the prior draws; see the section on prior draws.- chars
The number of characters of a hypothesis kept in its panel title. A longer one is cut and ends in
"..."before its last four characters, as in brms.NULLkeeps all of it.- colors
Two colors, as in brms. The first fills the histogram of the draws. The second draws the density of the prior draws, where there are any (see the section on prior draws). The default fills with light gray and draws the prior in a darker gray.
- theme
brms's ggplot2 theme.
NULL(the default) changes nothing. A ggplot2 theme object is not applied, and a warning says so. Anything else is an error, as in brms.- ask
If
TRUE(the default), prompt before each new page after the first on an interactive device.NULL, the default before this version, is taken asTRUE.- plot
If
FALSE, return the plot objects without drawing them.- ...
do_plot, brms's deprecated name forplot, is accepted with brms's warning. Base graphical parameters (main,lwd, ...) are accepted, as everyplot()method must accept them, and ignored with a warning that names them. A name that abbreviates an argument of this method is that argument, by R's partial matching, as in brms:col = "red"iscolors = "red", and stops becausecolorsneeds two colors. Any other argument is an error that names it.
What plot = FALSE returns
brms returns a list of ggplot objects, one per page, and draws them
unless plot = FALSE. frmtmb draws with base graphics and does not
depend on ggplot2, so it returns a list of frmtmb_hyp_plot
objects, one per page. Each holds the hypotheses of its page and the
settings of the call, and printing or plotting one draws that page.
The list is returned invisibly whether or not the call draws, as
brms returns its list.
Prior draws
brms overlays the density of the prior draws of each hypothesis
unless ignore_prior = TRUE, and so does this method, as a line in
the second of colors. A hypothesis of draws made by
frmtmb.sample::frm_sample(sample_prior = "yes") carries prior draws
wherever every parameter it names has them. A maximum-likelihood fit
has no prior, and draws made without prior draws have none, so their
prior_samples is all NA and only the posterior is drawn, as brms
does in that case.
Examples
set.seed(1)
dd <- data.frame(x1 = rnorm(80), x2 = rnorm(80))
dd$y <- rnorm(80, 1 + 0.5 * dd$x1 - 0.2 * dd$x2)
fit <- frm(bf(y ~ x1 + x2), family = gaussian(), data = dd)
h <- hypothesis(fit, c("x1 > 0", "x1 + x2 = 0"))
plot(h, ask = FALSE)
 # the page objects, drawn one at a time
p <- plot(h, plot = FALSE)
length(p)
#> [1] 1
p[[1]]