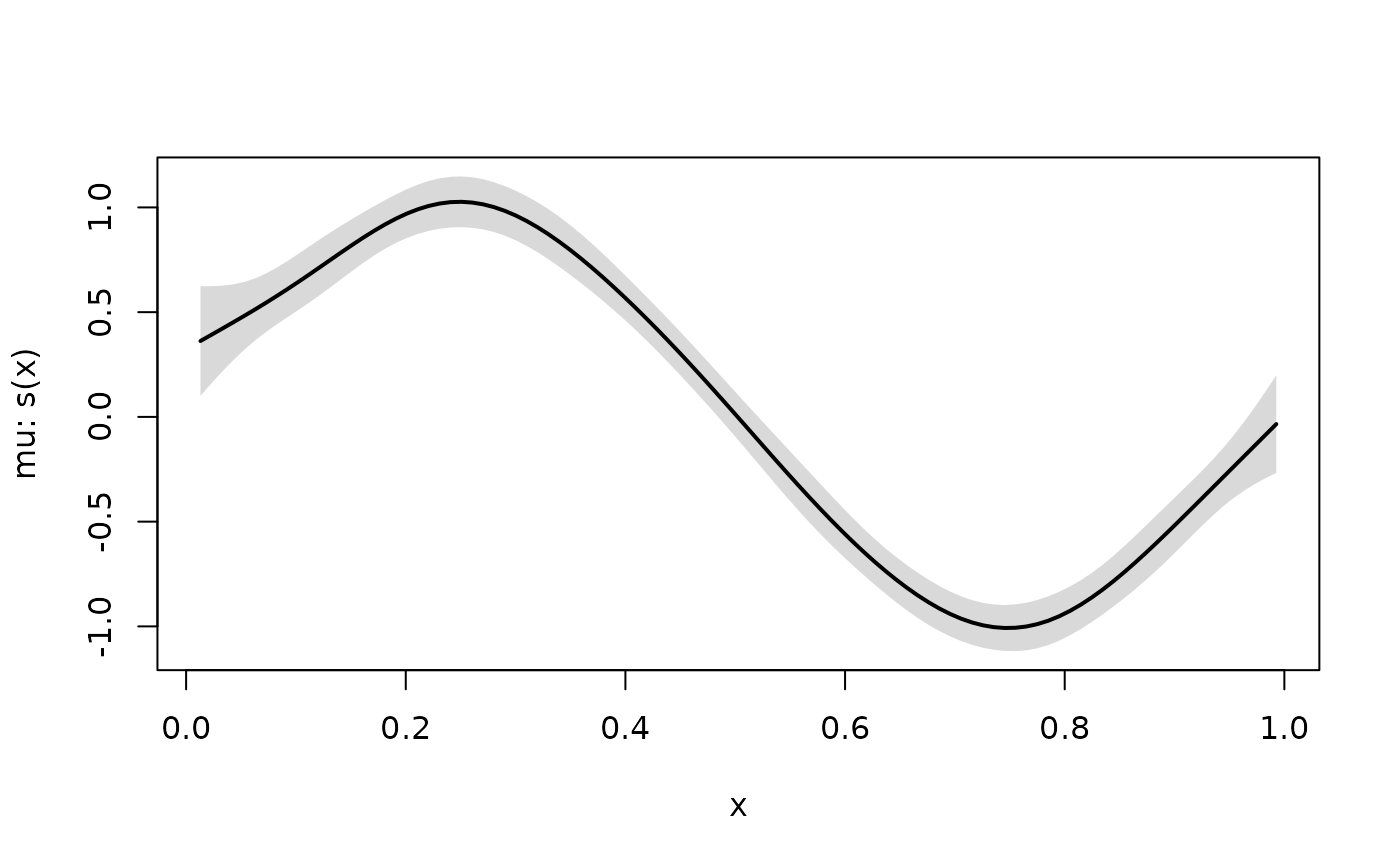
Draws each smooth term (s(), t2()) of a model on its own: the
term's contribution to its linear predictor over a grid of its
covariates, without the intercept or any other term. This is brms's
conditional_smooths(), with brms's grid, keys and column layout.
conditional_effects() draws the expected response instead, where a
smooth is one term among the others.
Usage
conditional_smooths(x, ...)

# S3 method for class 'frmtmb_fit'
conditional_smooths(
  x,
  smooths = NULL,
  int_conditions = NULL,
  prob = 0.95,
  spaghetti = FALSE,
  surface = TRUE,
  resolution = 100,
  too_far = 0,
  ndraws = NULL,
  draw_ids = NULL,
  nsamples = NULL,
  subset = NULL,
  probs = NULL,
  ...
)
Arguments
- x
A
frmtmb_fit, or draws fromfrmtmb.sample::frm_sample().- ...
Refused by name.
- smooths
Character vector of the terms to draw, as written in the formula (whitespace does not matter):
"s(x)","s(z, by = f)".NULL(the default) draws every smooth term.- int_conditions
Named list of the values a covariate takes, as in
conditional_effects().- prob
Coverage of the band.
- spaghetti
TRUEadds one curve per posterior draw as the attribute"spaghetti", for a term whose first covariate is numeric and that is not drawn as a surface. A maximum-likelihood fit has no draws and refuses it.- surface
Whether a term of two numeric covariates is drawn as a surface over both.
FALSEdraws the second covariate as a moderator at three values.- resolution
Number of grid points for a varied numeric covariate.
- too_far
For a surface: remove grid points farther than this from the data, on the unit square.
0(the default) keeps all.- ndraws, draw_ids
For draws: how many evenly spaced draws, or which draws, to use. A maximum-likelihood fit refuses both.
- nsamples, subset
brms's deprecated spellings of
ndrawsanddraw_ids.- probs
brms's deprecated spelling of the two band quantiles, which replaces
probwith a warning.
Value
A named list of data frames, one per term and linear
predictor, keyed as brms keys them: the distributional parameter,
the response of a multivariate model and the nonlinear parameter,
joined by _, then ": " and the term, for example
"mu: s(x)", "sigma: s(z)" or "mu_a: s(x)". A frame has the
term's covariates and by variables, effect1__ and (for two
covariates) effect2__, cond__, then estimate__, se__,
lower__ and upper__. Its attributes are response (the key),
effects, surface, spaghetti and points (the observed
covariate values). The list has class
"frmtmb_conditional_effects" and the attribute
smooths_only = TRUE, so plot() draws it.
Details
Every smooth term is drawn, a term indexed by a grouping factor (a
factor-smooth s(x, g, bs = "fs") or a bs = "re" smooth) included.
This is the rule re_formula = NA has everywhere in frmtmb: it drops
the (... | g) group-level terms and keeps every smooth, as brms
does.
The grid
The grid follows brms. A term's covariates vary and its by
variable is a second covariate or a condition:
A numeric covariate takes
resolutionequally spaced values over its observed range. When it is the second covariate andsurfaceisFALSE, it takes its mean and its mean plus or minus one standard deviation instead, as a moderator.A factor covariate takes each of its levels.
A term of one covariate and a
byvariable takes thebyvariable as its second covariate. A term of more than two covariates varies the first two and holds the others at their mean and mean plus or minus one standard deviation (numeric) or at each level (factor), labeled incond__.int_conditionsgives the values of a covariate by name, as values or as a function of the observed column.With two numeric covariates and
surface = TRUE(the default) the grid isresolutionbyresolutionand the term is drawn as a surface.too_farthen removes the grid points farther than that from every observation, on the unit square, withmgcv::exclude.too.far().
The band
On a maximum-likelihood fit estimate__ is the term at the estimate
and se__ is its delta-method standard error, over the covariance of
the term's coefficients: the null-space coefficients (fixed effects)
and the penalized ones (random effects, conditional on their modes
as a smooth's are). lower__ and upper__ are estimate__ plus the
normal quantiles of prob times se__. The term is on the linear
predictor scale, so the band is symmetric. On draws from
frmtmb.sample::frm_sample() the columns are brms's: the median, the
median absolute deviation and the quantiles of the drawn curves.
See also
conditional_effects() for the expected response,
make_conditions()
Examples
set.seed(1)
dd <- data.frame(x = runif(150), z = runif(150))
dd$y <- sin(2 * pi * dd$x) + dd$z + rnorm(150, 0, 0.3)
fit <- frm(bf(y ~ z + s(x)), family = gaussian(), data = dd)
cs <- conditional_smooths(fit)
head(cs[["mu: s(x)"]])
#>            x  effect1__ cond__ estimate__       se__   lower__   upper__
#> 1 0.01307758 0.01307758      1  0.3623918 0.13357736 0.1005850 0.6241987
#> 2 0.02297259 0.02297259      1  0.3917888 0.11845892 0.1596136 0.6239640
#> 3 0.03286761 0.03286761      1  0.4213117 0.10461483 0.2162704 0.6263530
#> 4 0.04276262 0.04276262      1  0.4511149 0.09256451 0.2696918 0.6325380
#> 5 0.05265764 0.05265764      1  0.4813676 0.08282101 0.3190414 0.6436938
#> 6 0.06255265 0.06255265      1  0.5122432 0.07573663 0.3638021 0.6606843
plot(cs, ask = FALSE)