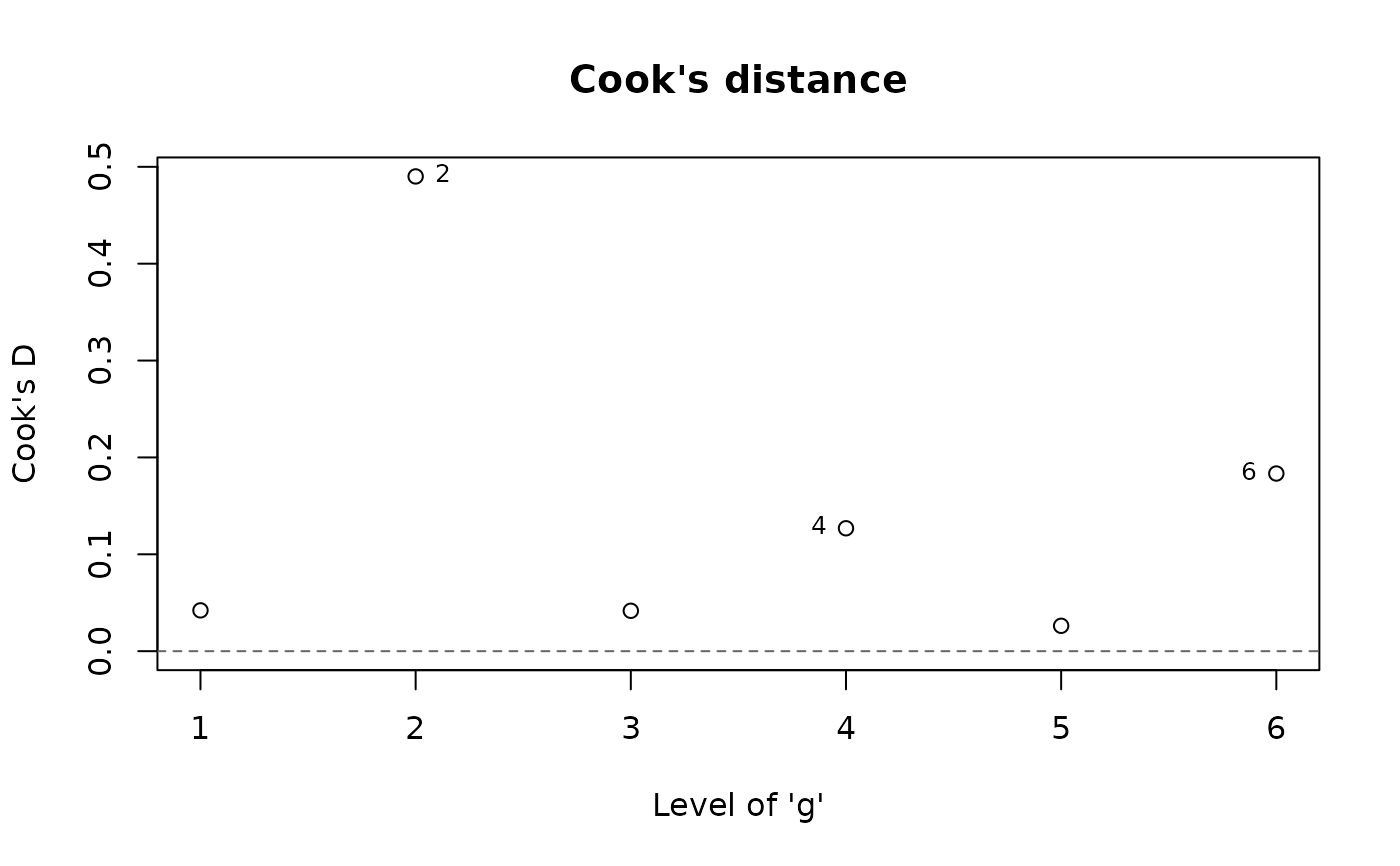
Draws the influence() result as base-graphics index plots: Cook's
distances first, with the most influential cases labeled by name,
then one dfbetas panel per fixed-effect coefficient. Each dfbetas
panel carries the conventional +/- 2 / sqrt(n) reference band, n
being the number of deleted units (Belsley, Kuh and Welsch 1980).
Usage
# S3 method for class 'frmtmb_influence'
plot(x, which = NULL, ask = NULL, labels = 3L, ...)
Arguments
- x
A
frmtmb_influenceobject frominfluence().- which
Panels to draw:
1is the Cook's distance plot,1 + jthedfbetaspanel of thejth coefficient. Defaults to all of them.- ask
Pause between panels; defaults to
TRUEwhen more than one panel goes to an interactive device, theplot.frmtmb_fit()rule.- labels
Number of extreme cases to label in each panel.
- ...
Passed to the underlying
graphics::plot()calls.
Details
This is deliberately NOT a car::influencePlot() counterpart:
hatvalues and studentized residuals are OLS-geometry approximations
to case deletion that are ill-defined for a fit whose random effects
are marginalized by the Laplace approximation, and the refit-based
quantities plotted here are the exact version of what those
approximate.
Examples
# \donttest{
set.seed(7)
dd <- data.frame(x = rnorm(60), g = factor(rep(1:6, 10)))
dd$y <- rnorm(60, 1 + 0.5 * dd$x + rnorm(6, 0, 0.5)[dd$g], 1)
fit <- frm(bf(y ~ x + (1 | g)), family = gaussian(), data = dd)
#> Boundary (singular) fit: sd_g__Intercept is at zero. The likelihood does not change as it moves further that way, so it has no standard error (NaN in summary(), vcov() and confint()); the other standard errors are kept. lme4 reports such a fit as singular; diagnose() lists the components at the boundary
infl <- influence(fit, groups = "g")
# Cook's distances only
plot(infl, which = 1)
 # }