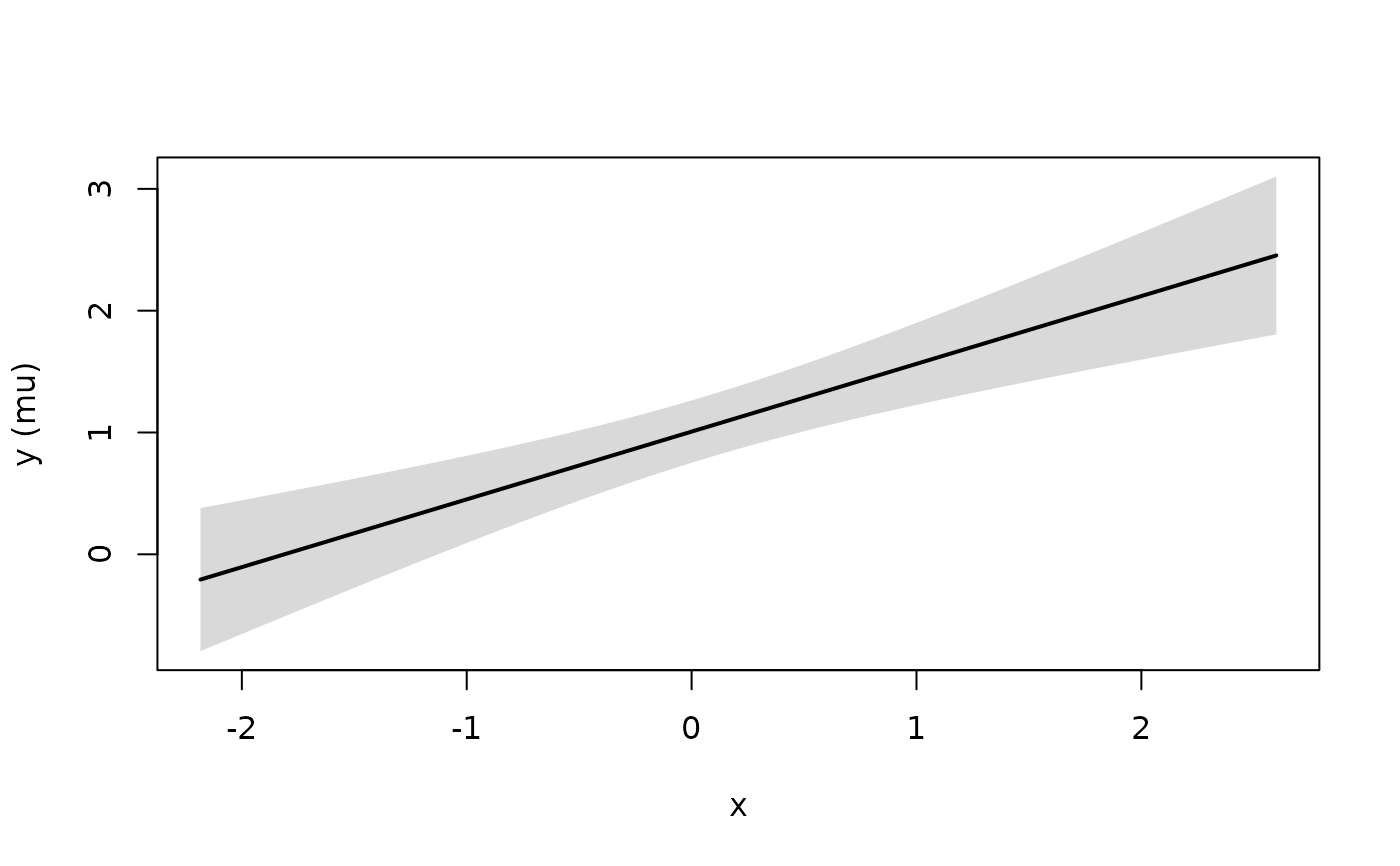
Draws the displays of a conditional_effects() or
conditional_smooths() result, one page per effect, with base
graphics. The method takes the arguments of brms's
plot.brms_conditional_effects(), in brms's order.
Usage
# S3 method for class 'frmtmb_conditional_effects'
plot(
  x,
  ncol = NULL,
  points = FALSE,
  rug = FALSE,
  mean = TRUE,
  jitter_width = 0,
  stype = c("contour", "raster"),
  line_args = list(),
  cat_args = list(),
  errorbar_args = list(),
  surface_args = list(),
  spaghetti_args = list(),
  point_args = list(),
  rug_args = list(),
  facet_args = list(),
  theme = NULL,
  ask = TRUE,
  plot = TRUE,
  ...
)

# S3 method for class 'frmtmb_ce_plot'
print(x, ...)

# S3 method for class 'frmtmb_ce_plot'
plot(x, ...)
Arguments
- x
A
frmtmb_conditional_effectsobject, or onefrmtmb_ce_plotfor the print and plot methods of a plot object.- ncol
Number of panel columns for a display with several conditions. The default lays the panels out roughly square.
- points
If
TRUE, draw the observations over the curves. Not allowed for aconditional_smooths()result, whose curves are not on the response scale.- rug
If
TRUE, draw a rug of the observed values of the varied predictor along the horizontal axis, for a numeric predictor.- mean
If
FALSE, omit the estimate line where the effect carries spaghetti curves. Without spaghetti the line is always drawn, as in brms.- jitter_width
Deprecated in brms in favor of
point_args = list(width = ), and it warns here as it warns there. A non-zero value spreads the observations horizontally.- stype
How a surface (
conditional_effects(surface = TRUE)) is drawn:"contour"(default) draws colored contour lines,"raster"draws a colored image.- line_args, cat_args, errorbar_args, surface_args
Named lists of settings for each part of the display; see the section on the layer arguments.
- spaghetti_args, point_args, rug_args, facet_args
Named lists of settings for each part of the display, as the four above.
- theme
brms's ggplot2 theme.
NULL(the default) changes nothing. A ggplot2 theme object has no meaning for base graphics: it is not applied, and a warning says so. Usegraphics::par()instead. Anything else is an error, as in brms.- ask
If
TRUE(the default), prompt before each new page after the first on an interactive device.NULL, the default before this version, is taken asTRUE.- plot
If
FALSE, return the plot objects without drawing them.- ...
do_plot, brms's deprecated name forplot, is accepted with brms's warning. Base graphical parameters (col,main, ...) are accepted, as everyplot()method must accept them, and ignored with a warning that names them. Any other argument is an error that names it.
What plot = FALSE returns
brms returns a list of ggplot objects, one per effect, and draws them
unless plot = FALSE. frmtmb draws with base graphics and does not
depend on ggplot2, so it cannot return ggplot objects. It returns the
closest thing base graphics has: a list of frmtmb_ce_plot objects,
one per effect and named as the effects are. Each object holds the
effect's data frame and the settings of the call. Printing or
plotting one draws it, as printing a ggplot object draws it. The
objects cannot be extended with + the way a ggplot object can. The
list is returned invisibly whether or not the call draws, as brms
returns its list.
The layer arguments
brms passes line_args, cat_args, errorbar_args,
surface_args, spaghetti_args, point_args, rug_args and
facet_args to the ggplot2 layer that draws each part. This method
translates each element that has a base-graphics counterpart and
ignores the rest with one warning that names them:
colour(orcolor,col),fill,alpha,linewidth(orlwd),linetype(orlty),shape(orpch) andsizeare translated.sizeis the point size (cex) for points and the line width for lines. Inline_args,fillandalphacolor the band, as they color the ribbon of brms'sgeom_smooth().widthinerrorbar_argsis the width of the error-bar caps in units of the axis, as in ggplot2.widthinpoint_argsspreads the observations horizontally by up to that much on either side.sidesinrug_argspicks the axis the rug is on:"b"(the default) or"t". The rug marks values of the horizontal axis, so"l"and"r"draw nothing, as in brms.binsinsurface_argsis the number of contour levels.ncol,nrowandscalesinfacet_argslay out the panels of a display with several conditions.scales = "free"or"free_y"gives each panel its own vertical range.
As in brms, mapping, data and inherit.aes cannot be set, and
each list must be named.
Examples
set.seed(5)
dd <- data.frame(x = rnorm(120), f = factor(rep(c("a", "b"), 60)))
dd$y <- rnorm(120, 1 + 0.5 * dd$x + (dd$f == "b"), 1)
fit <- frm(bf(y ~ x * f), family = gaussian(), data = dd)
ce <- conditional_effects(fit, effects = c("x", "f"))
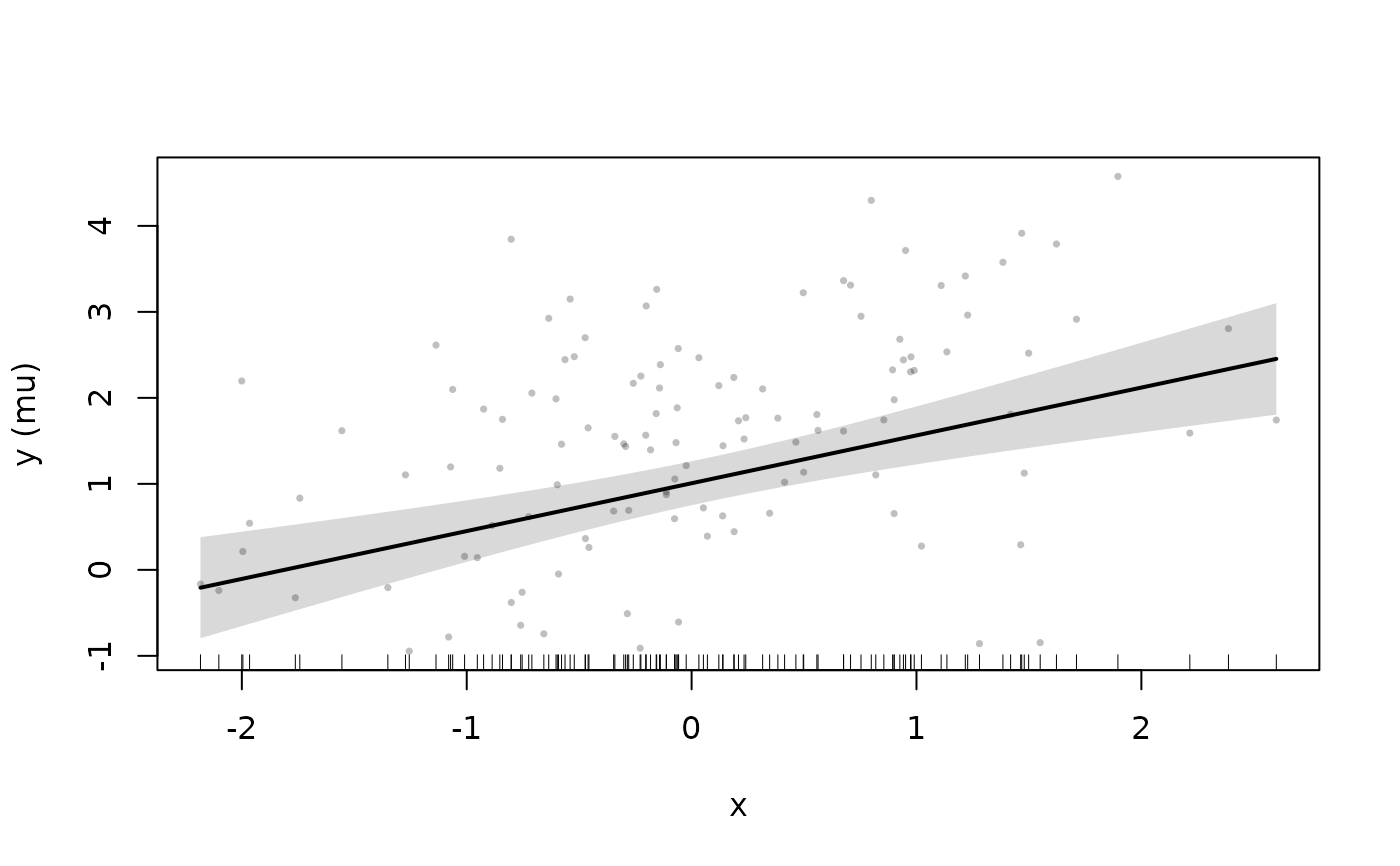
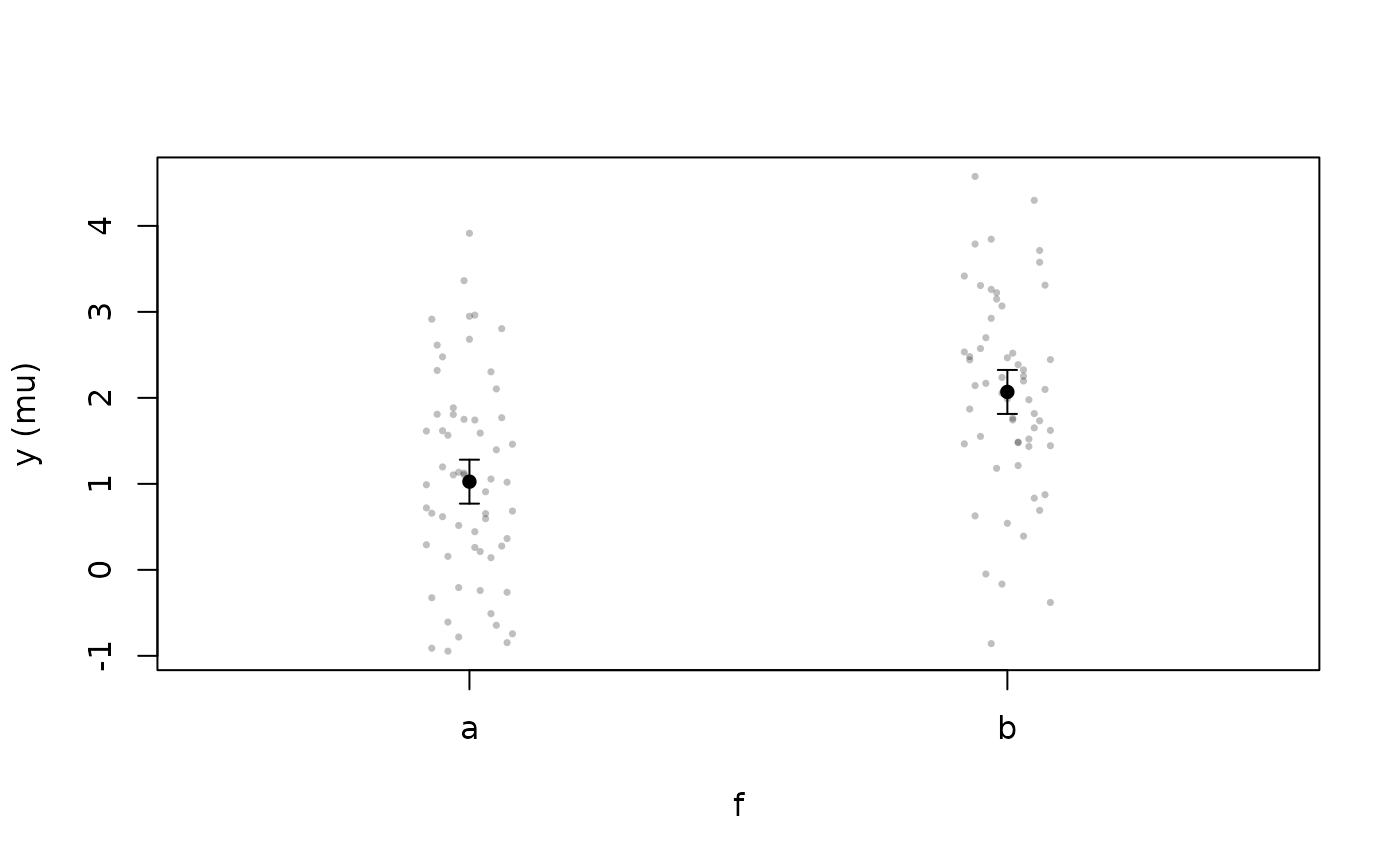
plot(ce, points = TRUE, rug = TRUE, ask = FALSE)
 # the plot objects, drawn one at a time
p <- plot(ce, plot = FALSE)
names(p)
#> [1] "x" "f"
p$x